This post will tell you why you need to start visual reporting for your startup, and how to go about putting together a basic dashboard.
You already know this: What gets measured, gets done. You already know this too: Humans instinctively respond to visual cues So do this: Use visual dashboards for your startup
I’m going to start this post by saying that Gengo doesn’t have a perfect track record in choosing KPIs (Key Performance Indicators) or “key metrics”, we don’t have the world’s best dashboards, and we don’t display data to customers and translators perfectly 🙂 But we know this, we know what we should be doing, and we’re getting there. So it’s worth sharing our knowledge to date.
Contents of this post
1. Why and what to measure
Why you need visual reporting
Why you need to share the dashboard
Choosing what to measure
Choosing time periods
2. How to do it
Why visual reporting was hard
How we did it wrong
Designing data
3. Tools and services
How to do it: External tools
How to do it: Do-it-yourself
Why you need visual reporting
Data is, by nature, kinda dull. It’s very hard to do the following in numerical data:
See trends
See progress towards targets
Compare/correlate values
Demonstrate ‘danger’ or ‘success’
See groupings
Scan quickly
All of which I would argue you gotta do if you’re going to steer the startup ship. Visual reporting allows you to communicate quite complex data in a few instants, which means more people in the company understand things, and spend less time wondering.
Why you need to share the dashboard
I think it’s vital to have a visible, clearly accessible (and always-on) display machine in your office so that all members of the team can see metrics. We have a Mac Mini running two 24” displays constantly, and I’d like us to go bigger soon. Total cost, about $1,000 (and it functions as our stereo via AirFoil). The reason it’s important to share visibly is that you should be seeing the data not just when you’re thinking of it, but *all* *the* *time*.
Visitors to our office love the screens, because they show that we’re on top of things (or have the semblance of being) and most of our client companies don’t have anything nearly as cool.
I’d even go so far as to say it’s healthy for a service such as ours to post uptime data, capacity etc publicly on the website. We’re not quite there yet but it’s a definite aim.
Our glamorous office
Choosing what to measure
Choosing your KPIs/Key metrics is down to your company (not me!) and is a topic for another day. But I believe choosing the right time period is also really important. You should be measuring different aspects of things over different time periods. Here are some examples (which are by no means right for everyone).
Daily/instant
Seeing if the site is down (duh)
Seeing if you just got a huge amount of traffic from a new source
Seeing if there is a new bug affecting a large area of the site
Seeing if you’re a trending topic on twitter for #shittycompany
Specific to Gengo: Problematic jobs in the system, Problems with the API or String, Problems with job notifications going out to translators
Weekly
Unique visitors
Top Referrers
Revenue
New customers
Support tickets
Iteration velocity (dev team)
New bugs reported (dev team)
Specific to Gengo: Job turnaround times, New translators, Job feedback ratings
Monthly
Booked sales
Sales in pipeline
Support response times
Conversion rates
Twitter followers
Specific to Gengo: Word count volume, Top customers, Top translators, Language capacities, Language feedback ratings
Quarterly
Gross margins
Customer churn
Customer spend trends
Specific to Gengo Translator churn, API usage, Plugin-specific API usage, Translator work trends
I’m not going to go into yearly because it becomes more and more obvious. You get the picture.
Choosing time periods
A good dashboard will allow you to compare and switch between time periods easily. Ideally you want to be able to map trends and create projections using past data too. The trick is choosing datasets that are not too granular, and not too broad. I’m assuming you’re measuring trends more as you increase time period, e.g. if you are measuring something daily, you’re measuring the trend in that figure weekly, etc.
Obviously if you have a high-traffic service, you can measure conversion rates etc much more quickly, because you have higher volume coming through. So you might move metrics up and down the chain.
There’s a real danger in checking stats too frequently, and ‘live’ dashboards make that too easy. For a good example, read Nicholas Nassim Taleb (yeah the Black Swan guy)’s book Fooled by Randomness, where he uses the example of a dentist whose stocks are actually doing well, but who looks at them too frequently. Description from a review site:
“As the dentist watches the market more frequently, he starts experiencing comparable number of highs and lows. No doubt the highs are more frequent than lows. However, as Taleb points out, the emotional impact of a loss is higher than that of an equivalent gain. The portfolio is the same. The returns remain the same. However, more frequent observation increases the emotional drain. Emotions cannot differentiate the ‘noise’ from the information”
Why visual reporting was so hard
If you think about it, getting good visual reporting for your data has been tough because it meant combining three skills:
Knowledge of what to look for (Business guy/Founder/CEO)
Ability to get the data (Developer, DB guy)
Ability to present the data (Designer)
Actually, visual reporting has been easy for specific things for a while. Google Analytics has had pretty graphs and good tools for drilldown for what-seems-like ages. But for your own data, from your own database, it could be time-consuming.
Now most successful startup founders have a bit of all three skills, right? So you can do it. But it’s not easy, and that’s why it often gets neglected. But things are getting a lot easier, with off-the-shelf/SaaS tools, built-in reporting in services, and better do-it-yourself plugins and tools to speed up dev time.
Visual reporting should be developed with the fastest iterations your company can possibly achieve i.e. if you can do it all by yourself, or with a built-in tool, do it.
It should change as you learn more (i.e. in a small startup, you might need to change things once a month or more)
What I mean is that the person who needs the data, and the person who is getting the data, should either be the same person, or joined at the hip while they are creating the dashboard.
Because you don’t really know the exact structure of the data you need until you see it. And you will need to iterate so quickly on that chart that if it requires something like email to go back and forth, you will be wasting shitloads of time.
How we did it wrong
Actually, we did it right, then we did it wrong, now we’re doing it right again.
The first dashboard:
Back in 2009 when we’d just started, we made a dashboard that pretty much encompassed everything we wanted to measure on the business. We designed it and got it together in 2 weeks, because the person who designed it (me) and the person who did the HTML (me) and the person who did all the SQL and PHP (Matt) were sitting right next to each other in our luxurious booth. So anything we wanted to tweak we just did right there.
Looking back on it, it is not visual enough, but it is actually pretty good. We still use that dashboard almost every day (although we use other tools for more specific data).
In 2010 we made a new, better dashboard which was designed to show all our data with a ‘backwards’-style reporting view showing the last three months and rolling 30-day numbers. I spent a couple of hours choosing numbers, then passed it over to Matt, and Matt passed it to Florian (our awesome SQL guru) who then spent time getting it perfect according to the assumptions we’d all made at the beginning. All the queries were optimized, all the numbers are perfect, all the numbers were there. You could filter by language pair and level and time period and everything.
But sadly:
The page takes ages to load (because there is SO much data)
Too much data on it
No visual data
So I have used it 10-15 times, total, in 12 months. I ended up writing my own SQL scripts and dumping to CSV-> Excel 2-3 times per week, then making my own charts out of that. (I want to make it clear this was my fault, not the guys working on the dash).
The new, better solution:
We now take a different approach, combining ‘off-the-shelf’ dashboard tools with our own custom charts. It is SO much faster, more agile (eugh sorry for the buzzword) and more satisfying.
Geckoboard for Google Analytics, Zendesk, GetSatisfaction, Twitter (and soon for much more custom data via our own server). See below for more on Geckoboard.
Custom Charts using PHP/MySQL and HighCharts (see below) for graphing. I can now whip up a new chart in 20-30 mins (much quicker if it’s a simple series) and use it on live data, pushing it to the big screens in the office within a few seconds. So when we are doing a big translator acquisition push, or looking for trends in conversion data, I can get that visual really easily. Here are a few examples — BTW the data probably makes a LOT more sense to us than it will to someone outside of the company.
You don’t need to read anything else. Tufte brings together simply *stunning* examples of true communication through visual data. His rules will help you eliminate all the bullshit and create charts that truly speak to the user — normally by removing, rather than adding information.
Geckoboard is *really* interesting. It’s a customisable dashboard tool that uses great, chunky blocks that output graphs, numbers etc which you can drag around and rearrange — it feels very plug-and-play and very cool. They just launched, so we’ve just started playing with it. But the concept is killer because of this: You can plug in any data because they have a totally generic “API connection” tool. This means you can output your own live data from your site and mix it in with other stuff like Zendesk, GetSatisfaction, Twitter etc within the same display. Geckoboard starts at $9 per connected viewing device (e.g. a laptop is one device) per month.
Haven’t used it much, looks interesting especially if you have a *lot* of data — but it seems to be built much more around Excel. They have iPhone and iPad apps that look comprehensive. Pricing is a bit murky, some versions are for free.
Gooddata
We use Gooddata occasionally because of their default free Zendesk integration. Their site feels a bit clunky and it’s hard to edit the reports easily. Pricing starts at $500/month so it’s a pretty significant investment.
Dundas
Dundas seems to have been around for a while but basically looks like a less-attractive version of Geckoboard. I guess this is a bit unfair because it seems to be very powerful. However for a startup it seems likely to be expensive.
Services with visual reporting built in:
Of the tools we use (most of which are listed here) the best visual reporting is built into Xero, which has lovely charts available almost everywhere it seems. Nice work.
Do-it-yourself tools
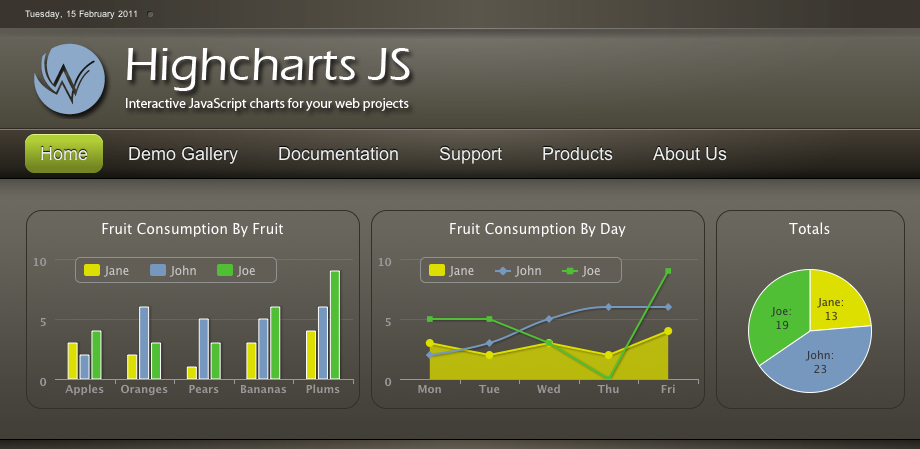
What we use: MySQL + PHP + CodeIgniter + jQuery + Highcharts
I’ve found Highcharts to be really simple and configurable enough to do basically everything we want. You can create column, line, bar, pie charts within the comfort of jQuery, pulling in data from wherever on your own server. The kick-ass part is that it includes a no-configuration-required PDF exporter — pretty awesome huh! So you can print out a copy and mail it to that one luddite investor you picked up in your friends-and-family round 🙂
I’ll add more suggestions as the comments come in.
Summing up
The best start is a simple one — I recommend if you haven’t yet, simply try charting different trends in your data. You will get hooked pretty quickly. Good luck, and we’d love to hear your suggestions in the comments.
Go global with Gengo’s people-powered translation platform.
Robert is one of Gengo's co-founders. He was born in Australia, and has lived in Melbourne, London, Hong Kong and Tokyo. Before founding Gengo, Rob was a designer and programmer, working for companies like Last.fm, The Brand Union and Dare Digital in London. Robert speaks enough Japanese to get into trouble, but not enough to get out.